What Is Project Reporting?

Reporting… it’s what a project manager does. No matter whether you are a travel freak or a professional learner, you must have created a report once in your life, either by hand or with reporting tools.
A Project Management Report is an overview of the current status of the project. It is a record of the state of a project at a given time.
According to the size and complexity of your project, the project report may be required weekly or monthly. This report is provided to all stakeholders to keep them up to date on the project progress.
It is the use of formal and informal reports to communicate the status of your project. It is an effective way to manage expectations from your stakeholders and team members as well as provide the scope, time and budget for your project.
Project reports may not seem the most glamorous part of your job, but they have the power to ensure whether or not projects finish according to the plan.
Why Project Reporting Is Important?
The project report is a way in which you can communicate with your stakeholders and team members. Whether it’s done weekly or daily, you get a quick and easy way to keep team members focused on the goal. Ultimately, it results in less micromanagement and interruption.

Most of the project managers see project reporting as a little more than a box-ticketing exercise. They know, they need to create a report. They know the fact that they have to tell customers and stakeholders about delays, progress, spend, and any issues that have arisen.
It is an important cornerstone for setting up an enterprise. It is a business plan to convert a business idea into a productive venture. The significance of a project report is as follows;
Serves as a Master Plan
For successful management, effective planning is absolutely essential. A project report serves as a business plan indicating the objectives or goals of the enterprise & states in detail how these objectives are going to be achieved at various stages of the enterprise.
Provides Roadmap
A project report is like a road map. It describes the direction in which the enterprise should go & how to reach the goal. Without well-defined goals and methods as mentioned in the report, most enterprises land in troubled waters and struggle on the rocks of hard times.
Shows Feasibility
A project report also shows the feasibility of the project and the possibility of achieving profit. Whether a project is feasible from different angles such as financial, commercial, social, etc. can be determined while preparing a project report.
Real-Time Tracking

Despite the name, project reports highlight so much more than just the amount of time you spent on a project or task. They keep clients up to date with real-time data and improve communication. Reporting allows you, your team, and stakeholders to track the current project progress against the original plan. Through reports, you can track tasks, issues, risks, budget, and overall project health.
Helps in Decision Making
Important decisions have to be made at various project stages and they can be taken with the help of a project report. Anticipated issues can be highlighted for discussions & decisions can be taken for the required course correction. It also allows for timely review of key open items.
Assess Profitability
Project report helps assess if the CAPEX and OPEX are in-sync with the expected profitability of the proposed project. You can quickly gauge the planned vs. actual time and cost to decide if it’s still a profitable venture.
Improves Visibility
Visibility is the most important aspect of project reporting. You gain complete insight into your project performance, whether it’s on schedule, within budget & are the risks under control etc.
Evaluates Organizational Goals

A project report helps to evaluate the organization objectives, to what extent they are achievable. For this purpose, an entrepreneur is expected to consider the input data, analyze the data, predict outcomes, choose the best alternatives, take action, measure results with predictions. It also helps to quantify the objectives. It makes them measurable, tangible, attainable, and verifiable.
Provides Better Customer Experience
Being professional, reliable, and transparent can lead customers to trust your brand more. And project reporting is a vital part of this overall customer experience. If your project report is clear, compressive, and easy to understand, then it can build confidence in you and your professionalism. It is a key to maintain a strong relationship.
Provides Control on Overall Project
Reporting puts you in control of your project. It allows you to see the progress, stagnation, or regress of certain elements, how team members are performing, and the quality of work completed.
Drives Project Success
If there’s an element of your project that requires reporting, people report on it. If there’s an element that doesn’t, people obviously don’t. The knock-on effect? That neglected part of your project falls by the wayside and you and your team are not working as efficiently as you could be.

Types of Project Management Reports:
Project reporting is not only communicating with your team and stakeholders about the latest project updates. You can also use project reports to reduce risk, monitor timeliness & budget, and build accurate project plans.
Here are a few project reports you might find useful:
- Status report
- Time tracking report
- Resource Availability & Utilization report
- Risk assessment
- Baseline reports
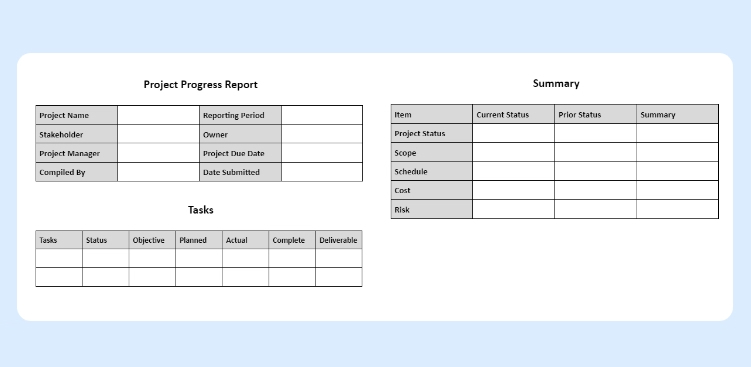
Status Report
A weekly status report is an easy way to keep your team and stakeholders informed about the project progress. This report provides detailed information about the project like which task is completed, which is about to complete, which resource is assigned to what task, what are the risks, and budget status.
Time Tracking Report
A time tracking report shows how much time your team is actually spending on project tasks. This helps you to identify the potential budget shortfall before they occur and provides valuable insight for future project estimates.
Resource Availability & Utilization Report
A time tracking report shows how much time your team is actually spending on project tasks. This helps you to identify the potential budget shortfall before they occur and provides valuable insight for future project estimates.

If you want to build a perfect project plan, then you need to know what resources are available to get the task/project done. Availability shows how the tasks and activities are assigned across the project team & to avoid resource overloading.
At the same time Resource Utilization shows how your resources performed w.r.t their assigned tasks, schedule and estimates. A combination of the two helps you in effective resource planning and tracking the estimated vs. actual effort burndown.
Risk Assessment
A risk assessment enables you to identify and categorize project risks based on their severity. According to that you can prioritize issues and solve them before it wrecks your project success.
Baseline Report
This report compares your estimated timeline with your spent timeline. So that you can know the flaws of your past. It shows how the changes and delays affect the overall project timeline.
For many PMOs and resource managers, project reporting is seen as an essential activity, yet one which offers little value. We know we need to do it to keep customers and stakeholders up to date, yet it’s something that no one enjoys doing, and something we usually expend the bare minimum of energy on.
However, by taking a different perspective on project reporting, we can see just how important professional, transparent progress reports can be. And a good project management tool can help to do the same.
How Project Management Tools Can Help?

An online PM tool can improve the report building process. You can generate reports easily and quickly. Along with that, you can also monitor your team’s progress throughout the project.
Cloud-based PM tools collect data in real-time. When your team updates their timesheet or status, that information is fed instantly into the tool. So that you can get an accurate picture of the project.
PM software has made the project report creation easier. In just one click, you can create a project report. Get data from project status, tasks, timesheets, expenses or other project metrics. You can simply pick the data you want and with a single click, you can get the project report ready.
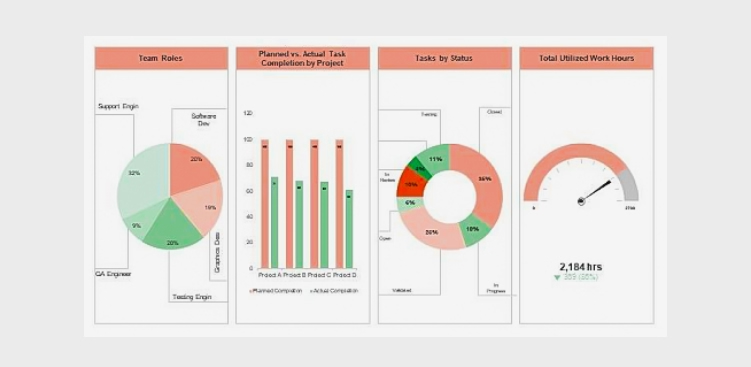
Metrics In Project Management:
If you want to track the progress of a project team, then Project Metrics are important. Project metrics include budget performance, project progress, safety, and others. By definition, a metric is any type of measurement which is used to measure some quantifiable component of performance. It can be collected through various observations such as the number of days late, or the number of defects found. When it is used in a monitoring system to assess a project, a Metric is called as an Indicator, or a Key Performance Indicator (KPI).

So in short, Project Management Metrics is a way to measure the success (or performance) of a project.
Project Metrics can be categorized into 3 main categories such as;
- Pure project management measurements
- Indicators of project success
- Indicators of business success
What Do PM Metrics Measure?
As we mentioned earlier, metrics are used to determine the success of the project. But how do we actually measure success?
Answer the following questions can help you to measure how successful your project might be;
- How well your project is doing with time? (i:e- is the project meeting the planned time frame?)
- How the project is meeting its budget? (i:e- is your project going over the planned budget?)
- How is the project utilizing resources? (i:e- how many hours and employees are being utilized to complete the project?)
- How well the project is meeting the scope? (i:e- how many changes have been requested and how many of them have been implemented?)
Key Requirements and Challenges of PM Metrics
Project Management Metrics help us to
-
- Measure and understand the maturity of the IS organization
- Manage projects and resources more efficiently
- Improve project performance year-over-year
All metrics should be
-
- Simple and make sense for the organization
- Measurable with clarity
- Traceable and supported by real data
Key Requirements

There are certain key requirements for the measurement of project management metrics:
- Repeatable and sustainable project management processes
- Data collection using a project management tool
- A performance baseline
- Clear communication of metrics, baseline, and any subsequent changes to metrics or the data collection process
- Avoid repetitive metrics
Challenges

Project management metrics implementation may face some challenges that need to be handled with proper processes and controls:
- Initial figures may go down as process compliance improves
- If the base data changes, the metrics change and have to be recalculated
- People may not pay much attention to metrics unless it impacts them individually
- When multiple deliverables are involved, people don’t want to set baseline until all requirements are defined
- Certain projects pose unique challenges such as requirements/analysis projects, as-time-permits projects, and internal maintenance projects
Different project management metrics can be defined based on a project’s objective and complexity.
Conclusion
Project Reporting isn’t just Box-ticking expertise. It’s much more than that. They keep the lines of communication open with clients, allowing you to resolve issues before they arise. Project reporting means you are covered if a client ever questions delays in progress or even threatens you. And, reporting means your customers see you as a reliable and professional partner.
By providing great project reports, you’re doing a lot more than just ticking boxes. You’re taking project management to the next level.
Consistent, project management metrics tracking helps project managers gain greater control over the projects and better odds for success. Organizations gain insights into which initiatives are successful and which ones need finer tuning. This can also allow time to make improvements for future projects. Finally, implementing project management metrics can build historical data to help improve future planning, and allow for comparisons.